Supply-demand is one of the most basic economic terms that cause change at the asset price. Not only for the forex market this statement is true for any kind of trading asset all over the world.
In microeconomics, the supply-demand model is very popular and as true that it is even allocated at the textbooks. This indicator shows the supply and demand zone based on the participants of the target asset.
This automatic MT4 supply and demand indicator work fine at any (major or cross) currency pair at any time frame but the time frame recommend is a 1-hour chart or higher.

When the demand is high for an asset or the buyers are willing to buy more of the asset the price goes up and if traders willing to sell more of the product the price falls for low demand.
This simple concept is very powerful to determine the price forecast or the future destination by observing or analyze naked charts.
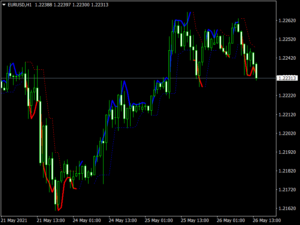
This indicator generally identifies that supply and demand zones and creates different colored lines at certain levels. Demand zones are marked by blue bars and supply zones are declared by red bars by this indicator.
As demand increases the price goes up and when the supply is completed or the demand decreases for a certain time the asset index falls.
Trading with this indicator is very simple, it suggests buy at demand zones and sell at the supply zones. So the take profit and stop loss positions or levels are also easily identifiable by this indicator.
Simply as the demand remains intact for the asset then continue the buy orders or take profits levels can be shifted to higher and for the increasing or continuous supply phase, the sell orders can be continued.
This indicator or concept works on any (cross or major) currency pair, stocks, or commodities.
Download Now
Related Free Mt4 Indicators
Don't Miss Pro Indicators