RSI Retrace Scalping MT4 is based on two commonly used indicators named Moving Average (MA) and Relative Strength Index (RSI).
Moving Average is a very popular technical indicator to find out the asset price movement and works fine at any currency pairs, stocks, or commodity index.
Relative Strength Index (RSI) is a very familiar momentum-based technical indicator that shows the recent and historical strength of the asset price by collecting data of the recent closing price of the asset.

This is a very user-friendly and easily applicable trading method that works fine on any major/cross currency pair and got a risk ratio of 1:2.
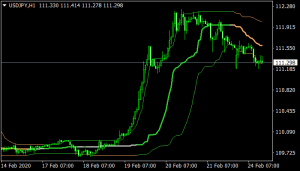
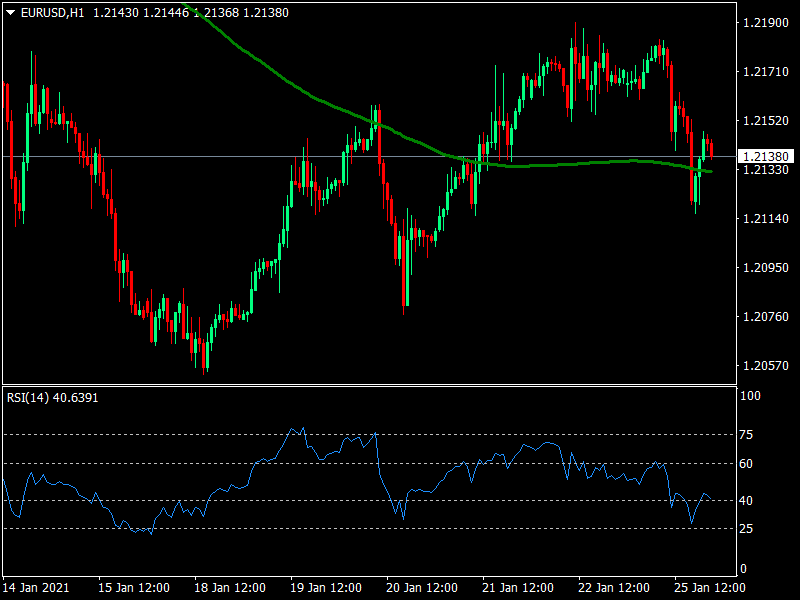
This strategy uses EMA (200) signal line at the main chart and an independent RSI indicator window at the bottom of the main chart to generate profitable trading ideas.
Price crosses or remains above the EMA (200) line indicates the asset price is at average bullish condition or buyers dominated asset price movement and vice versa.
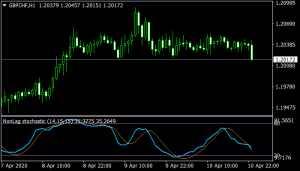
The RSI window has a range of 0-100, where four levels (25, 40, 60, 75) are marked and a dynamic (blue) signal line that shifts with the asset price movement.
When the price touches or remains above the upper (75) line, it indicates an overbought situation and if the signal line touches or remains below the lower (25) line, it indicates an oversold situation for the asset price.
This strategy suggests entry at the retracement points. When the blue signal line of the RSI indicator window touches or crosses below the 40 (not 25) wait until the price comes back above it and place a buy order.
Place a sell order when the blue signal line touches or crosses above the 60 and comes back and starts to move towards the downside.
Note: Before placing an order must check the price direction from the upper time frames to identify and avoid fake retracement points.
Download Now
Related Free Mt4 Indicators
Doda Stochastic Forex Trading Strategy
Don't Miss Pro Indicators