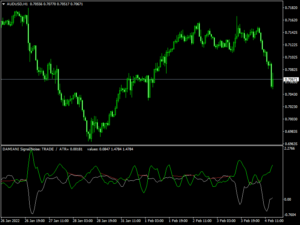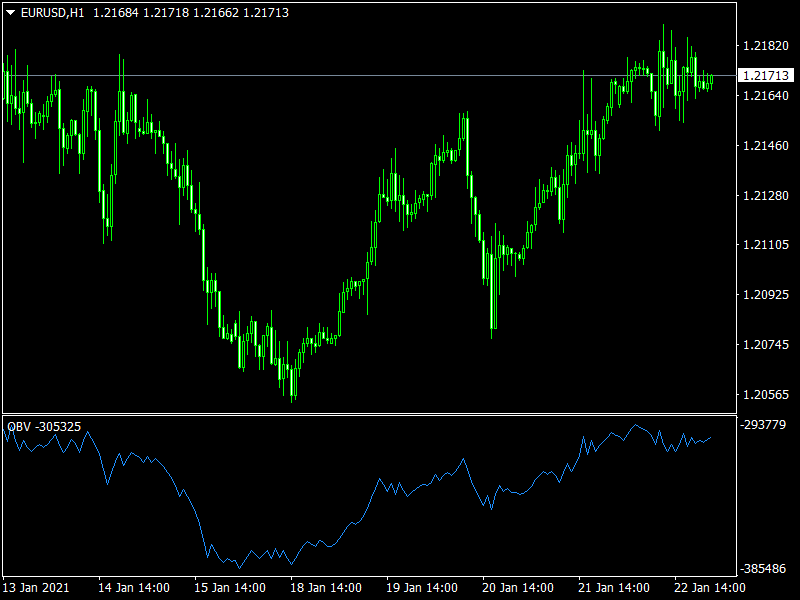
OBV Trend Indicator for MT4 is a custom made indicator that combines the price direction and volume data of the asset price and shows the strength at an independent indicator window.
This is a trend following indicator that uses not only the price action data but also the volume to get the future direction of the price.
To get this direction this indicator uses dynamic volume value, the positive values added with the current OBV value and the negative value is subtracted.

OBV trend indicator is a very simple and user-friendly indicator that got blue signal line.
When the OBV is headed towards upside or simply if the OBV rising that means the volume on positive days is higher/ superior to the volume on negative days ( and the blue signal line crosses or remains above the white signal line).
Simply this can be considered as a bullish scenario at the asset price.
When the OBV indicator is falling or headed toward the downside that is a representation that the volume on negative days is higher than the volume on positive days or a bearish price movement.
This indicator is very easy to use and shows very effective reading based on assets price and volume data to determine the market condition and determine the future price direction.
A multi-timeframe analysis is recommended before making any entry as the bird’s eye view helps us to find out fake price shifting points and avoid them.
Although this is a very effective indicator it’s not recommended to trade major pairs with this indicator during FOMC meeting minutes/announcements, FED interest rate decision, NFP, or any other trend changing international fundamental economic events to avoid risk.
Download Now
Related Free Mt4 Indicators
Doda Stochastic Forex Trading Strategy
Don't Miss Pro Indicators