This “Chart Pattern Dashboard” Indicator Scans ALL Currency Pairs & ALL Time-Frames For Powerful Price Breakout Patterns That Have The Highest Probability Of Winning…
Here are the patterns this indicator can detect: Head and Shoulders, Reverse Head and Shoulders, Rising Wedge, Falling Wedge, Triangle, Double Top, Double Bottom, Triple Top, Triple Bottom…

- The indicator displays all detected patterns on ONE convenient dashboard. And it recognizes all of the best price breakout patterns: Head and Shoulders, Reverse Head and Shoulders, Rising Wedge, Falling Wedge, Triangle, Double Top, Double Bottom, Triple Top, Triple Bottom…
- You no longer need to manually scan every pair and time-frame. The dashboard does all the hard work for you.
- With just one look at the dashboard, you’ll instantly know which chart pattern has just formed on every pair and every time-frame (from 1-minute to monthly)…
Hi there,
So everybody knows that chart patterns like Head and Shoulders or Triangle are particulary good at predicting breakouts.
But the reality is there are not a lot of traders who are profiting from these powerful chart patterns right now.
Why? Two problems:
- Identifying a valid price breakout pattern by yourself is hard as hell. It requires a lot of patience and practice.
- But let’s say you’re willing to spend your valuable time trying to identify every pattern manually, then you’ll also need to repeat this tedious process for each currency pair, each time-frame separately.
It’s definitely lots and lots of work. But if you want to eliminate all the stress, frustration, and overwhelm you feel scanning the markets manually for price breakout patterns, here’s the good news:
Let our “Chart Pattern Dashboard” indicator do all the heavy lifting for you…
First, it will scan ALL currency pairs and ALL time-frames for the most effective price breakout price patterns. And all these calculations are done so fast – literally within seconds – you won’t even notice the time.
Then, the indicator will display a beautiful dashboard on your chart where you can see exactly what price breakout pattern has recently formed on EVERY pair, EVERY time-frame.
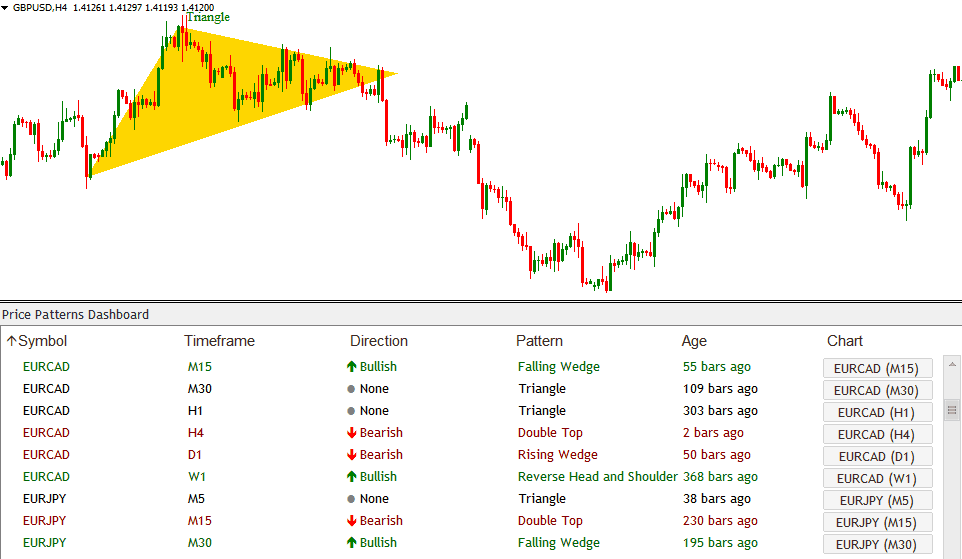
Take a look below to see how cool it really is:

With just one look at the dashboard, you’ll instantly know all the information you need to make a good trading decision. You’ll instantly know which chart pattern appears on every time-frame (from 1-minute to monthly) and on every currency pair.
Not only that, you’ll also know the exact direction of that chart pattern – whether it’s bullish or bearish. Please note that Triangle pattern has no intrinsic direction. It’s a both-way pattern, meaning that breakout can happen on either side of a Triangle.
And you’ll know exactly how long ago that particular pattern showed up.
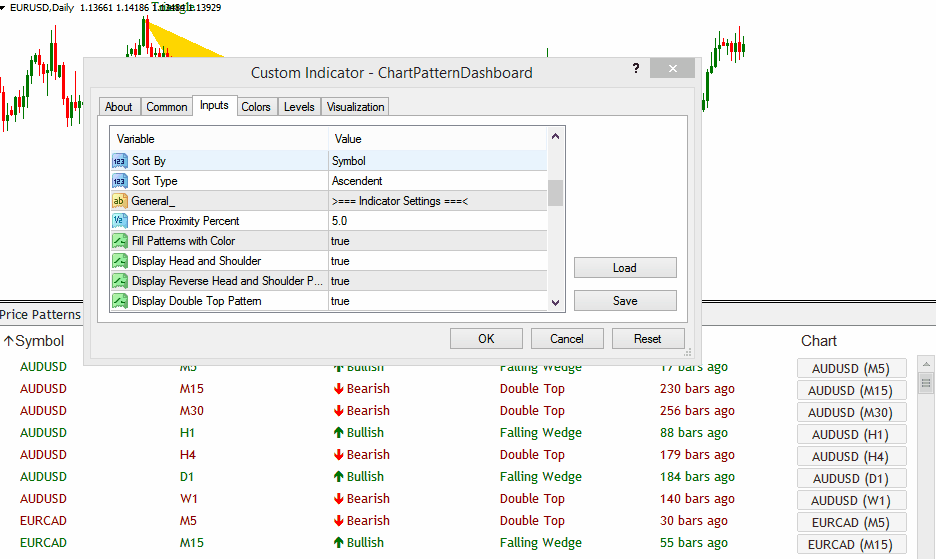
And you’re in total control. You can specify which currency pairs and which time-frame you want the indicator to scan for price breakout patterns:
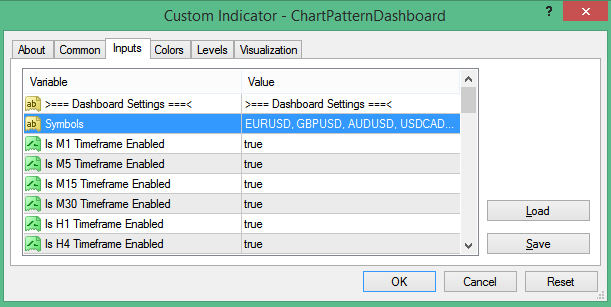
Remember, you can specify as many pairs as you like. You can also use it for indices, stocks, futures, and gold (anything your broker offers in Metatrader). Our price breakout Dashboard will take care of it all.
Let me show you a short clip where I scroll through 20 currency pairs (and all time-frames from 1-minute to monthly) and see all the patterns on my dashboard:

But maybe the most useful feature of the price breakout Dashboard indicator is…
Click on the symbol you want, and the indicator will open up that symbol chart with the price breakout pattern highlighted…
Take a look at this short clip to see what I mean:
That way, you can look at the dashboard first to see the overall picture across multiple time-frames. Then once you identify a chart pattern that you want to trade, just click on the symbol to open up the relevant chart, so you can analyze that particular pattern further.
And by the way, did you know that…
You can sort the dashboard in any way you like — based on Symbol, Timeframe, Direction, Pattern, or Age…
Let me show you exactly how it works:
Pretty cool, isn’t it?
Now, let me tell you about…
All The Best Price Breakout Patterns Our “Chart Pattern Dashboard” Indicator Can Detect For You…
Let’s go through each of them, one by one:
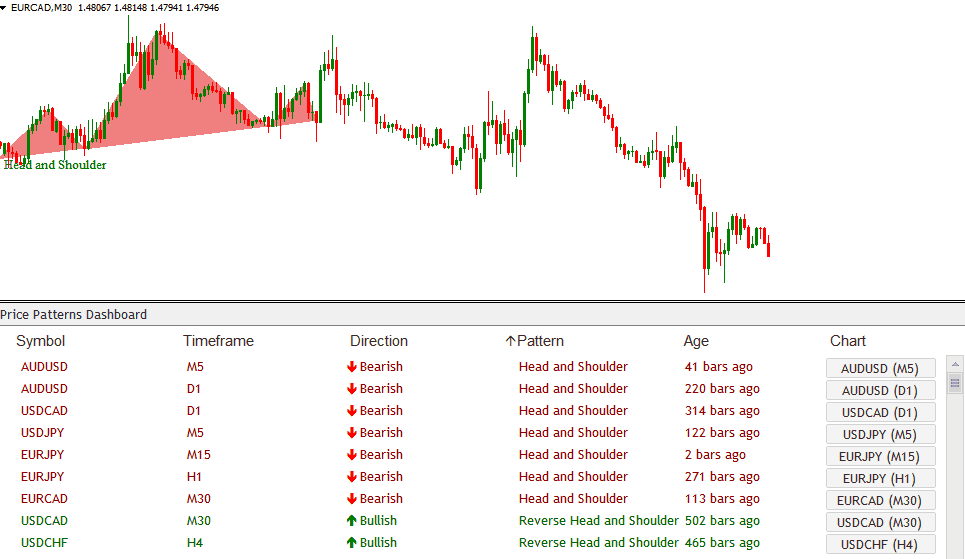
Head and Shoulders (and Reverse Head and Shoulders)
In the example below, you’ll see 2 “Head and Shoulders” patterns on EUR/CAD 30-minute time frame and USD/JPY 5-minute timeframe. And a “Reverse Head and Shoulders” pattern on EUR/CAD weekly time frame. All of these 3 patterns precede a significant market move in the predicted direction.
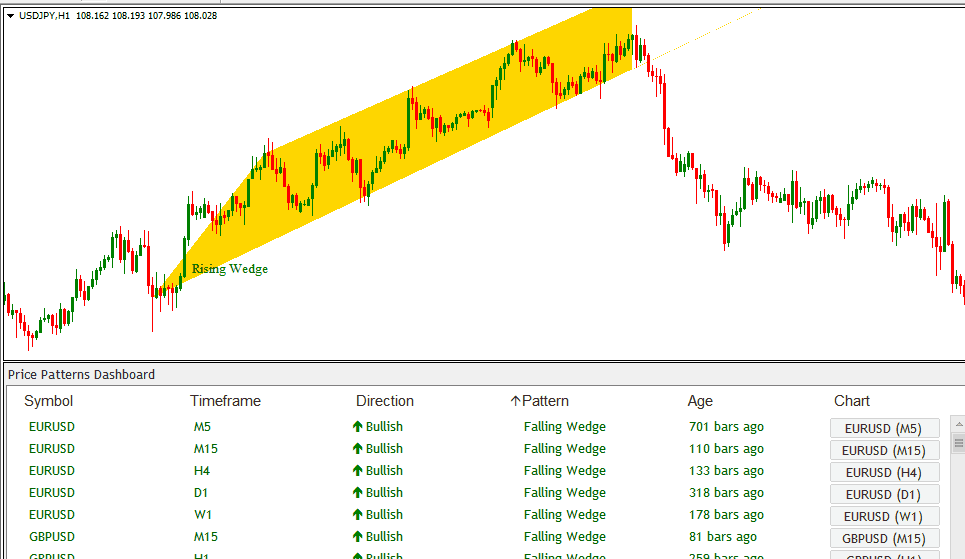
Rising Wedge and Falling Wedge
Look at the photo below. In this case, I sorted the dashboard by Pattern, so I can easily see all the Rising Wedge and Falling Wedge patterns.
Then, I clicked on the Rising Wedge patterns on EUR/USD 4-hour time frame, and USD/JPY 1-hour time frame to open up these charts. So you can see just how effective these patterns really are:
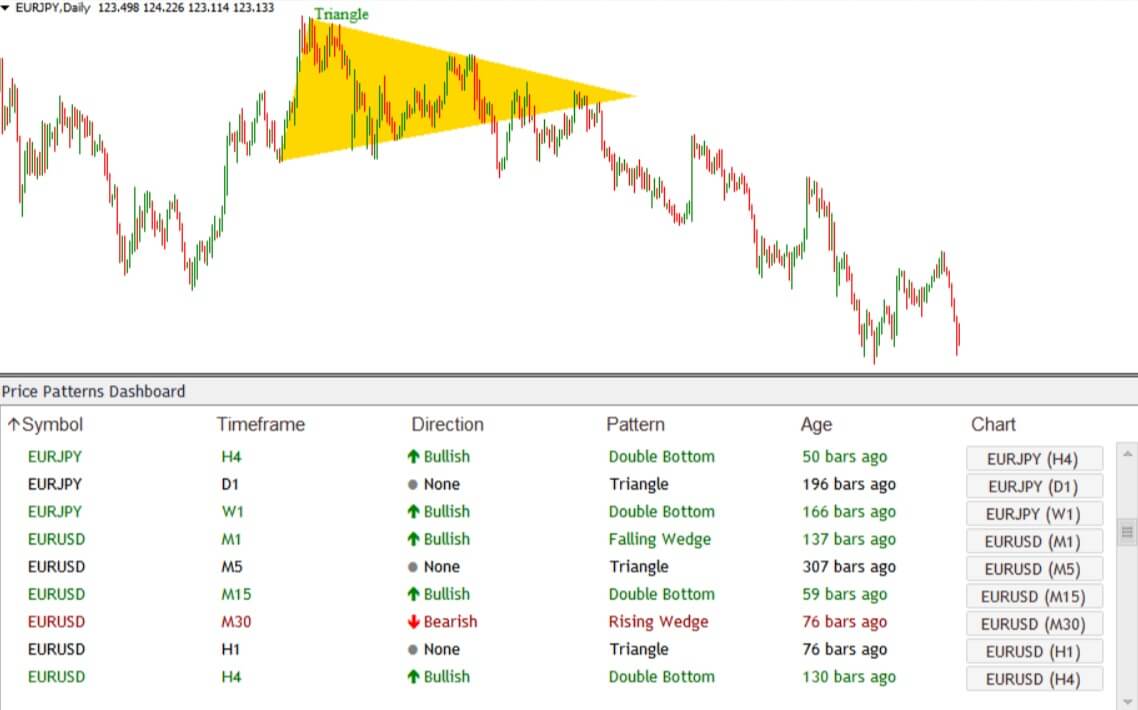
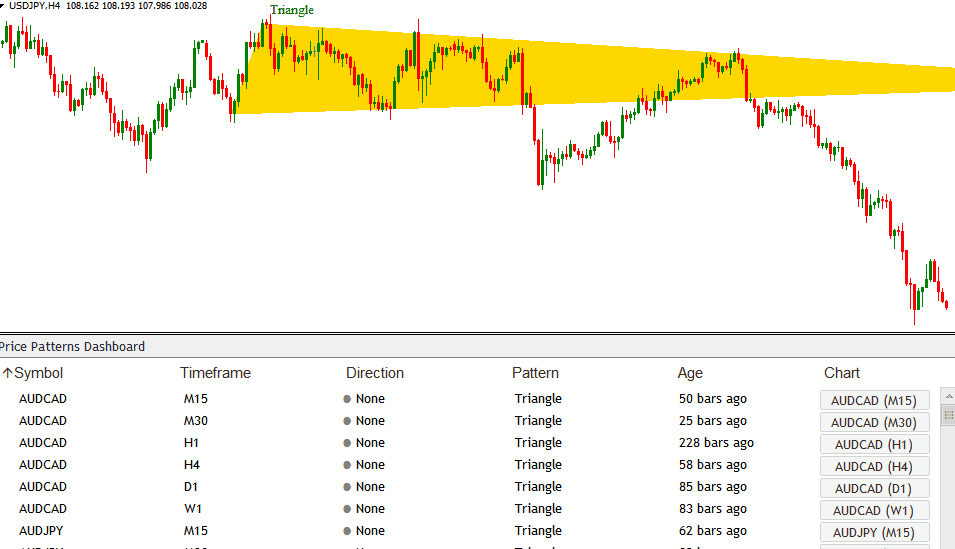
Triangle
Here’s a great example of Triangle patterns in action:
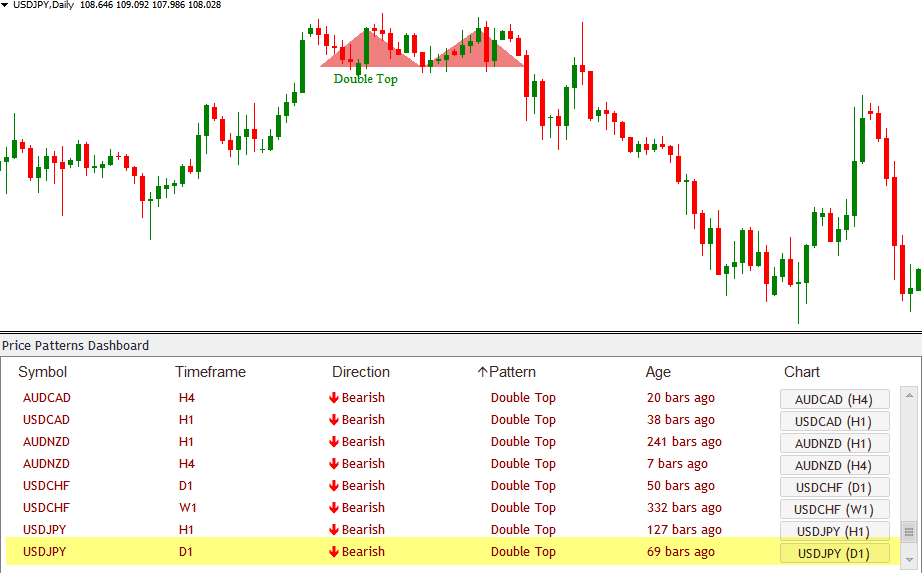
Double Top
This pattern is formed after the price tested a resistance level twice and got rejected. There’s a great probability that if the price breaks out to the downside, it would mark a change in trend from bullish to bearish. Here’s an example:
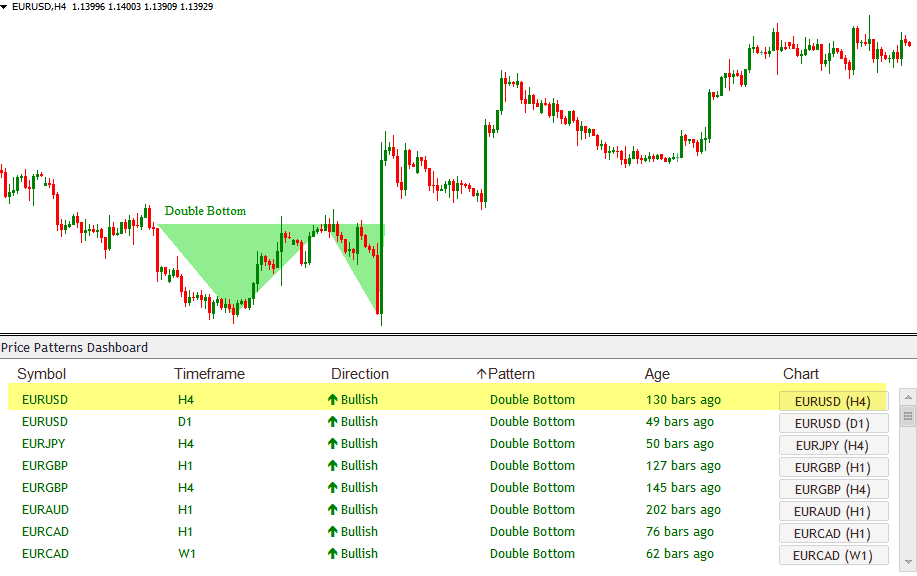
Double Bottom
This pattern is formed after the price tested a support level twice and got rejected. There’s a great probability that if the price breaks out to the upside, it would mark a change in trend from bearish to bullish. Here’s an example:
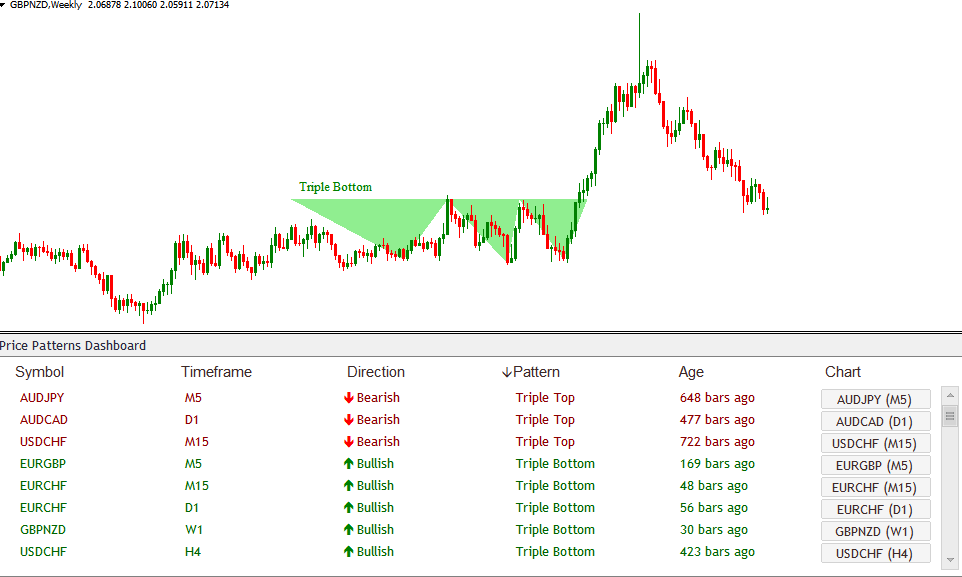
Triple Top and Triple Bottom
These patterns are similar to Double Top and Double Bottom. Except that in these case, the price tested a support (or resistance) level three times and got rejected:
And maybe the most useful part about price breakout patterns is that…
These patterns are UNIVERSAL. They work on all time-frames and all currency pairs (any instrument for that matter)…
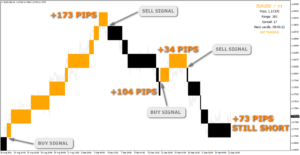
For example, let’s analyze a few price breakout patterns that have formed on the pair AUD/JPY on different time-frames:
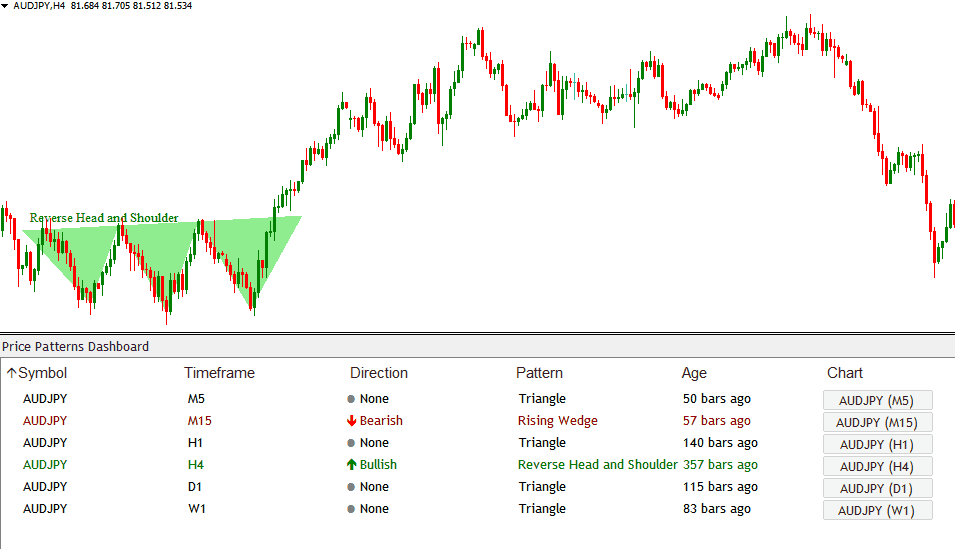
In this case, you see 3 price breakout patterns on 3 different time frames: 5-minute, 1-hour, and 4-hour.
All 3 are detected by the Chart Pattern Dashboard indicator. And all 3 patterns are followed by a large market move in the direction that the patterns correctly predict.
By the way, did you know that…
The Chart Pattern Dashboard indicator also gives you pop-up, visual, and audio alerts as soon as a price breakout pattern has completed.
So you will NEVER miss out on any important trade opportunity.
Buy Chart Pattern Indicator For Only $42.00
You will be forwarded to the download page after purchase
Paypal
Don't Miss Pro Indicators