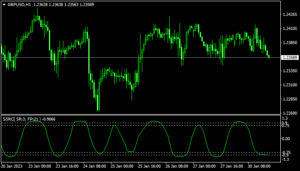
MT4 Buy Sell Indicator is a simple indicator that shows every price shifting points and trends are made by the price movement.
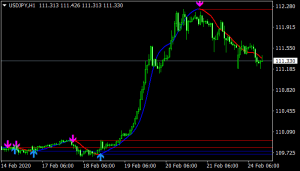
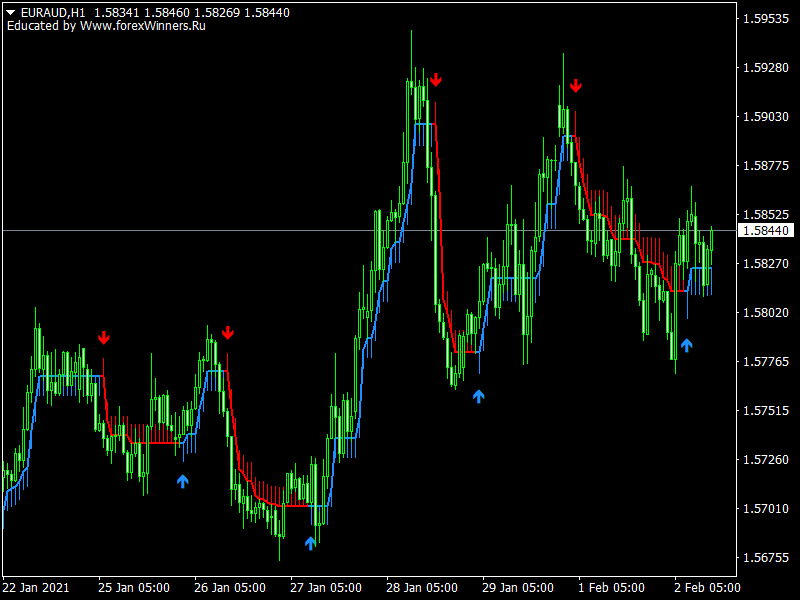
This indicator creates a blue arrow below the price candles when the bearish trend ends or simply after a valid lower low is created by the price movement.
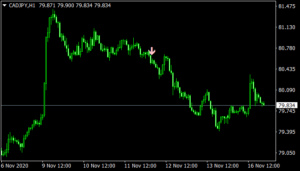
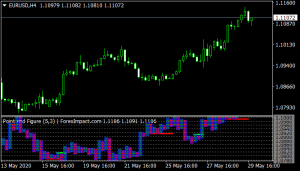
It also starts making blue bars below the price candles as a confirmation of the bullish trend and add those bars with a blue line. As the bullish trend ends this indicator creates a red arrow above the price candles that confirms a valid higher high is created.
As well as it starts to make red bars above the price candles and add them by a red line that can be count as a bearish trend or bearish price movement of the asset price.

This Buy Sell indicator works fine on any (major or cross) currency pair at the Metatrader 4 platform at any timeframe chart.
Place a buy order after the blue arrow bars appears below the price candles and place sell orders after the red arrow and bars appear above the price candles.
This is a scalping strategy means it is suggested to make an entry at short-term time frames but before placing an order it’s suggested to check the upper time frames for the confirmation of the price direction and avoid the fake price shifting points.

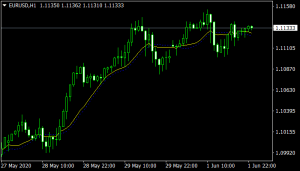
Combine Exponential Moving Average (EMA value of 25 or 50 or even 100) with this indicator could reduce more risk and get the most accurate trading positions.
When the price remains above the EMA line place only buy orders or constitute buy order and completely ignore the sell (red) arrows above the price candles.
Similarly, the price remains below the EMA signal line the place only sell orders and ignore the buy (bull) arrows below the price candles.
Note: As this is a scalping indicator avoid trade with this indicator during major fundamental economic events of related/target currency.
Download Now
Related Free Mt4 Indicators
Don't Miss Pro Indicators