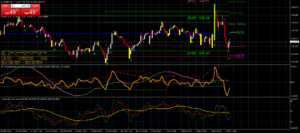
Traders Dynamic Index MetaTrader indicator or TDI is a unique type of indicator that uses some basic and popular technical indicators reading and show it at one independent window of Metatrader 4 platform.
This indicator uses Moving Averages, Volatility Bands, Relative Strength Index (RSI), and in the meantime a common indicator Bollinger Bands to generate profitable trading ideas.
This tool can be used or works fine at any type of major or cross currency pair and suitable for scalping, day trading, and catching swing trades.
Besides, the purpose of this indicator provides the full picture of the asset price condition to the traders related to their time frames. Sounds and visual alerts can be enabled for this indicator.

Parameters used at this indicator
RSI_Period (Default=13) RSI range is generally between 8 and 27.
RSI_Price (default = PRICE_CLOSE) You can select Price close, Price open, or other options.
Volatility_Band (default = 34) The ranges between 18 and 38 are tested. Remember, the lower the period, the sensitive your band is.
StdDev (default = 1.6185) Standard deviation multiplier for volatility bands. It’s very sensitive don’t modify or change this one.
RSI_Price_Line (default = 2) The first (fast) moving average of RSI.
RSI_Price_Type (default = MODE_SMA) Type of the first moving average of RSI.
Trade_Signal_Line (default = 7) The second (slow) moving average of RSI.
Trade_Signal_Type (default = MODE_SMA) Type of the second moving average of RSI.
UseAlerts (default = false) if true sound alerts will be played each time the red and yellow line is crossed.
The use of this indicator is very simple, first change happens at the green and red signal line. When price starts to make the bullish movement the green line crosses above the red line and vice versa.
If both the green and red lines cross above the yellow line (middle band), means the price at a bullish trend, and if they cross or remain below the yellow line so the price movement is bearish.
For a continuous upward movement the (blue) bands with all signal lines remain at the upper (50-68) level and lower (50-32) level for a continuous downtrend.
The green and red signal line touches or remains at the upper blue band means the price is in overbought condition and vice versa.
Download Now
Don't Miss Pro Indicators