TMA Slope Forex Indicator is a unique indicator that shows reading at an independent window below the main chart. Investors can use this tool to transform the accumulated history data.
Therefore, investors have an opportunity to detect various peculiarities and patterns in price dynamics that are not visible to the naked eye. This indicator works fine at the 15M, 30M, 1H, and 4H charts and suitable for any currency pair of the forex market.

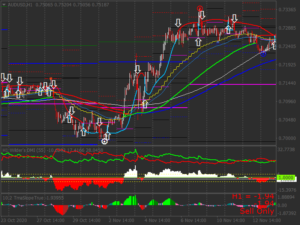
Based on the visualization of this indicator, it’s elementary to identify the market conditions. Therefore, the trend is a combination of slopes around a middle (0.0) line and histogram (different colored bars and dots).
The TMA Slope indicator is a simple slope of a Triangular Moving Average compared and normalized with the Average True Range of the last 100 periods.
Simply follow the dots and the bars (above or below the middle line) to find out entry positions. When the dots are white, the bullish pressure comes at the asset price and enters when the blue dots are seen at the bars below the middle line’s edge.
As the price continues to move higher, the red bars may become green (above the middle line) the dot color remains the same until the selling pressure comes up or traders lose interest to buy the asset.
Thus the bullish trend ends, and the price starts to fall; the dots at the bars’ edges become red till the bearish trend ends.
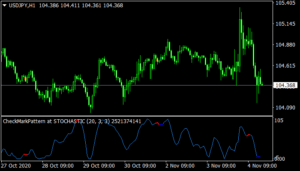
Before placing an order, compare the trading signal/order direction between two or more time frame charts for more accuracy and sort out the lower time frame charts’ fake price shifting points.
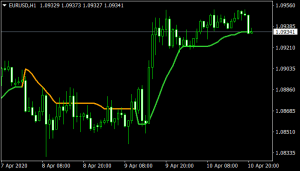
Small retracements of the lower time frame charts can be ignored by the nature of trading with this indicator.
Download Now
Related Free Mt4 Indicators
Overbought and Oversold Forex Indicator
Bollinger ATR Bounce Swing Forex Trading Strategy
Don't Miss Pro Indicators