HMA Dot Crossover Forex Trading Strategy is based on some basic technical trend-following tools. It is an easily applicable strategy for any type of trader (beginners to pro).
It is one of the most commonly used trading strategies which is suitable for any (major or cross) currency pair in the Hourly (1-hour) chart. This trading strategy uses different valued Moving Average (MA) that makes crossover during the price trend changes.

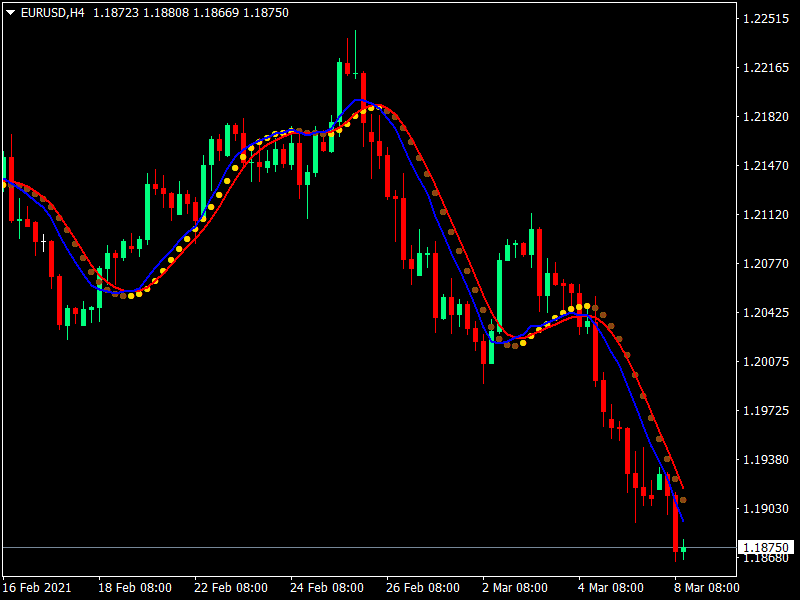
There are two different valued Moving averages to identify the trend shifting basis on the crossover type in this strategy. When the blue signal line crosses above the red line, the bearish trend is over, so the bullish force dominates at the asset price and vice versa.
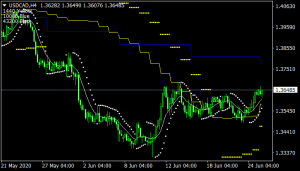
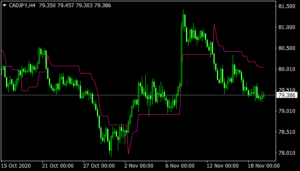
The HMA dot indicator is a modified version of the regular Hull Moving Average indicator, which calculates the traditional HMA indicator but draws the result differently.
This custom made indicator creates different (yellow and red) colored dots below and above the price candles instead of making lines as regular HMA indicators. This indicator’s yellow dots are for the uptrend market, and the red dot confirms the asset price is falling.
The idea is straightforward, enter buy orders as the blue MA signal line crosses above the red line and the yellow dot appears below the price candles.
The sell orders setup is when the blue line crosses below the red signal line, and red dots appear above the price candles. Hold or continue the orders as long as the trend remains intact and close the charges when the opposite cross occurs and contrasting dots appear.
Before making any entry, it’s suggested to verify the price direction and trend validity by looking at the upper timeframe charts.
Download Now
Related Free Mt4 Indicators
Don't Miss Pro Indicators